
Geovisualizations of Trafficking in Persons: Mapping a Clandestine Crime
Due to the urgency to understand the clandestine crime of trafficking in persons (TIP) and where it operates, publicly available maps of TIP characteristics, processes, and counter-trafficking initiatives have soared in recent years. Maps make visual relationships apparent that are not readily identifiable via other forms of data analysis. However, critiques and best practices of TIP maps are less developed and nearly non-existent leading to cartographic weaknesses. The geovisualization movement in the anti-trafficking field could be strengthened if it avoided overgeneralizations, state-based approaches, data with questionable quality, and isolated analysis.
Overgeneralization
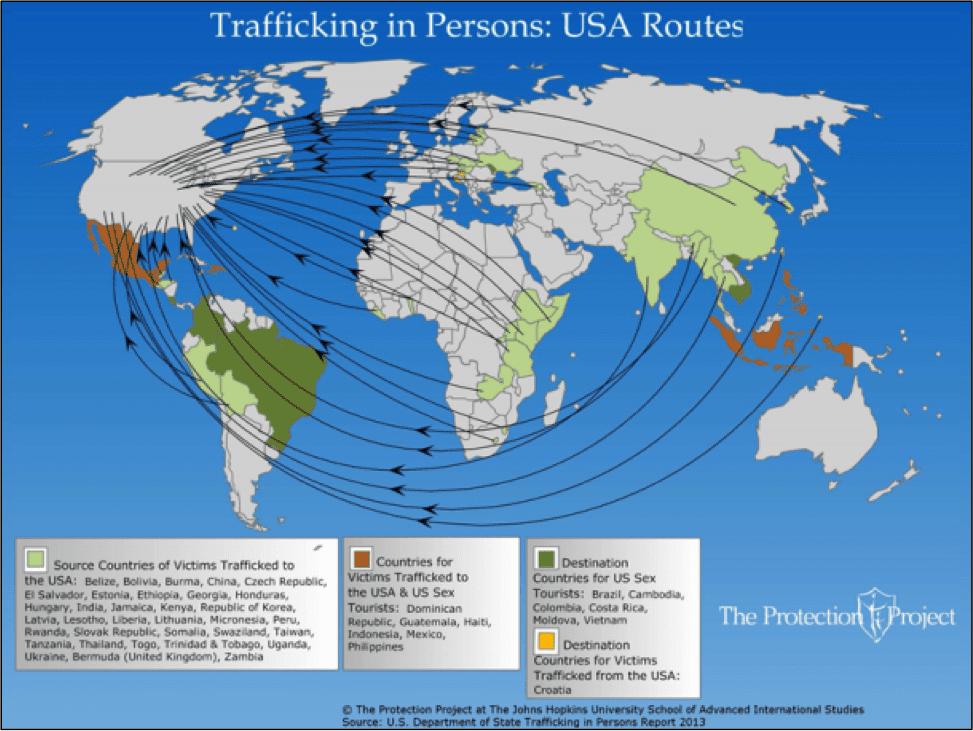
Many maps generalize TIP to the point that the crime is misrepresented. As seen in Figure 1, TIP route maps regularly overgeneralize the trafficking process by only identifying the origin, destination, and overall direction in which victims are moving. Notice there is no demarcation of transit points, if any, or actual transportation paths. Moreover, route maps often overgeneralize trafficking process characteristics by representing routes with the same symbol – a route traversed by 5 victims is symbolized the same way as a route traversed by 5,000 victims. Although all maps must generalize reality, what and how generalizations are made directly impact how map readers interpret the geovisual information. In this case, generalizations on where victims are trafficked can result in misinformed conclusions about the nature of TIP.
Figure 1: Trafficking in Persons: USA Routes Map by The Protection Project
 Map 1
Map 1
State-Based Approach
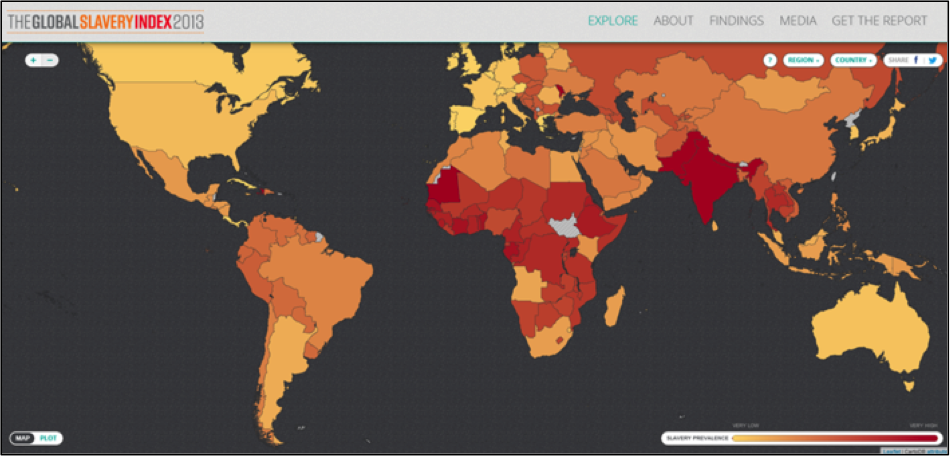
Most TIP maps rely on a state-based approach even though the crime is rarely state-based. Figure 2 highlights the prevalence of slavery based on state-level data. This is problematic because it gives the impression that the impact of and vulnerability to trafficking is evenly distributed throughout the state and that the crime is operationalized in the same way across the state. A state-based approach does not capture the variance and nuance that research tells us takes place within states and across state borders. Thus, mapping TIP requires a framework that incorporates attention to scale, and to shift analysis to the actual scales at which trafficking operates.
Figure 2: The Global Slavery Index 2013 by Walk Free Foundation
 Map 2
Map 2
Questionable Data Quality
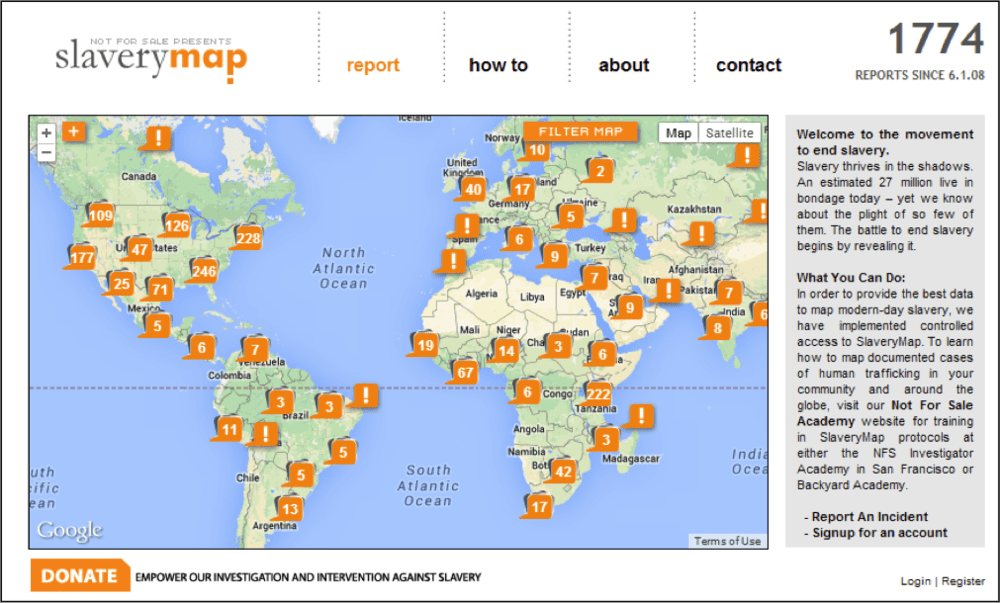
The quality of TIP maps is dependent on the quality of TIP data. Figure 4 is of Slaverymap.org, a web-based crowdsourcing mapping platform operated by Not for Sale Campaign. Individuals trained by Not for Sale can enter the details of open-source TIP cases. Crowdsourcing, by nature, means those entering data have discretion over what does and does not get registered and, in the end, what does and does not get mapped. Mapped TIP information is, therefore, dependent on individuals who may know very little about the crime or cartography. This is important to note since TIP is routinely discussed as a complex crime that is difficult to identify and classify. Thus, some TIP types, cases, or details may be more/less likely to be reported than others, introducing greater biases and inconsistencies, and compromising how TIP is understood.
Figure 3: Slaverymap.org by Not for Sale Campaign
 Map 3
Map 3
Isolated TIP Analysis
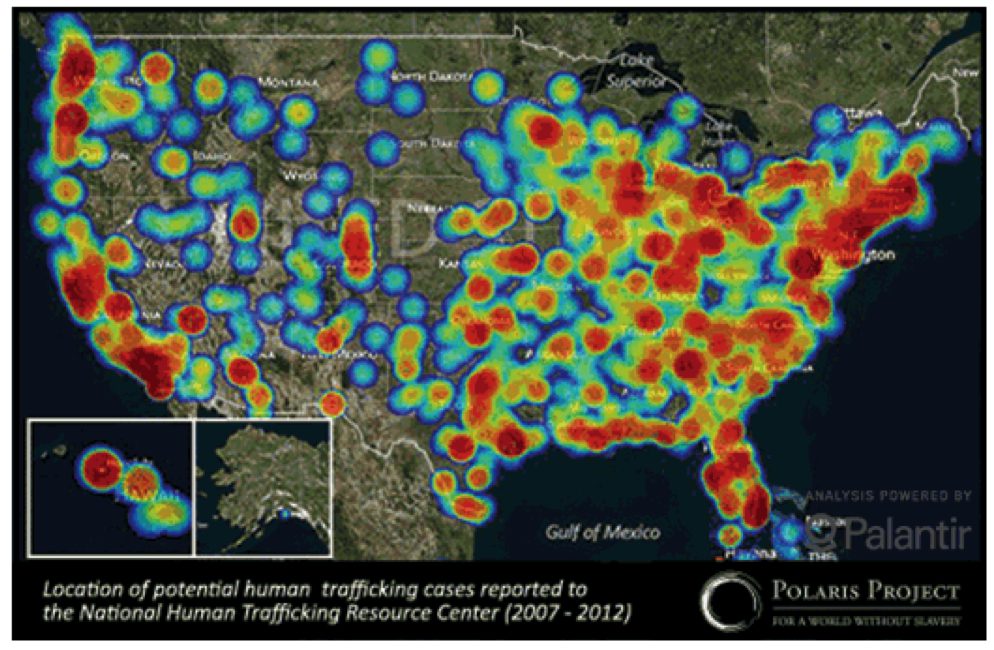
As seen in Figure 4, maps commonly represent TIP as isolated from other criminal activity even though there is mounting evidence that transnational organizations, such as TIP networks, are involved in multiple illicit activities. For example, it is argued that “areas where drug crime networks are well established are increasingly important growth areas for human trafficking.” Hence, mapping TIP alone may stunt our ability to see the crime as interwoven with other criminalities, thereby allowing the complexity and driving sources of TIP to go unnoticed and unstopped.
Figure 4: Potential Human Trafficking Cases by Polaris
 Map 4 jpeg
As the geovisualization movement gains momentum, more work will need to be done on the ethics of mapping TIP and the application of reflexivity for enhancing representations. There are inherent ethical issues associated with mapping hidden and vulnerable populations for public consumption, and these issues should be recognized, along with the responsibility that comes with geovisualizing criminal and sensitive data. Repercussions for making trafficking more visible may include pushing the crime further underground and increasing the risk of former, current, and future victims. Remarkably, there has been little documented discussion around examining the consequences of mapping TIP characteristics and processes and making the clandestine crime visible.
As a geographer, I regard “where” information as pivotal to answering questions of why. Knowing where TIP is occurring can help inform the understanding of why TIP is occurring. Geographic information can begin to address questions of why TIP occurs here and not there and why traffickers use one route over another. By knowing more about why TIP functions the way it does we may be better equipped to achieve the ultimate goal of preventing and curbing such exploitation.
Bethany Eberle is currently a Presidential Management Fellow at the Department of Labor. She holds a Master of Public Administration and a Master of Arts in Geography from Syracuse University’s Maxwell School of Citizenship and Public Affairs. This blog is based on Bethany’s master thesis “Human Trafficking Databases and Maps,” which analyzes geographic data collection and geovisualization trends in the counter-trafficking field and their impact on our understanding of the crime.